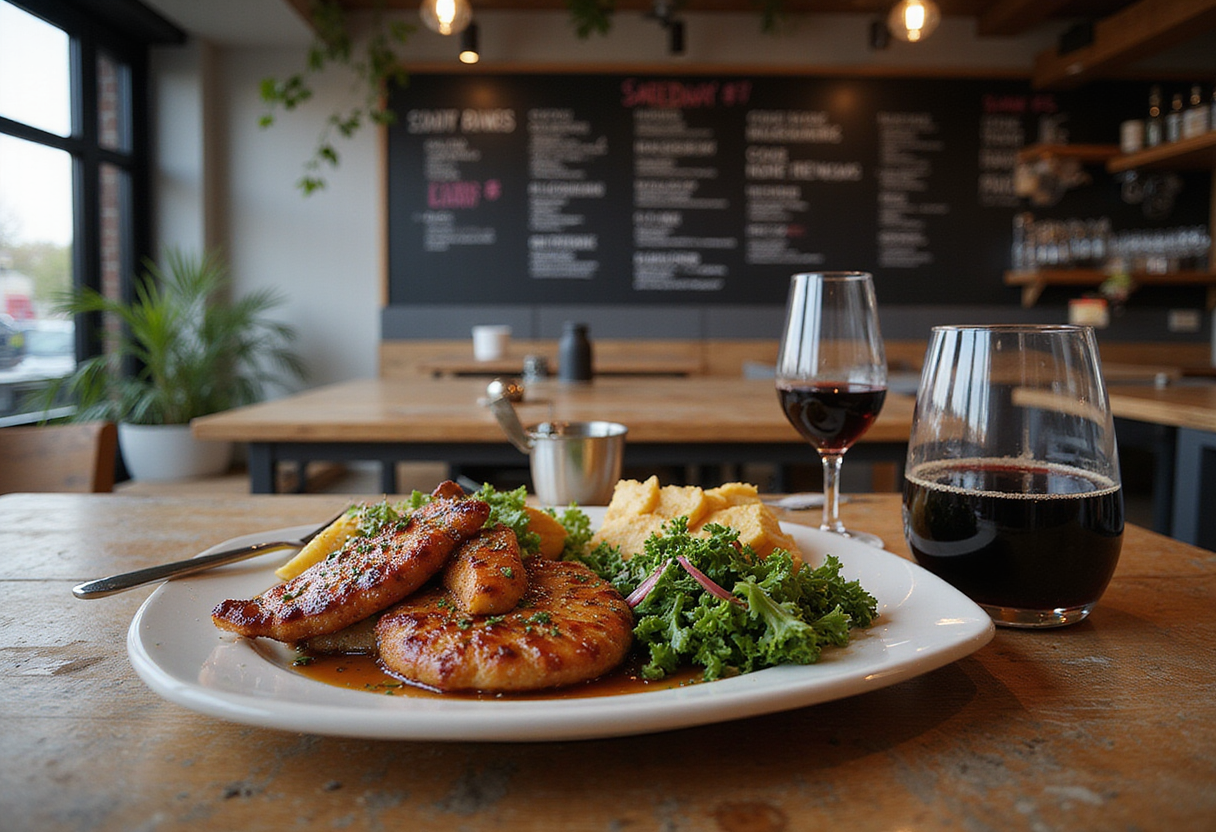
Visual Capitalist Ranking Maps the Global Dining Cost Spread
Visual Capitalist's ranking of where eating out costs the most and least lands as multi-unit operators weigh expansion strategy, pricing architecture, and unit economics for upcoming development cycles.
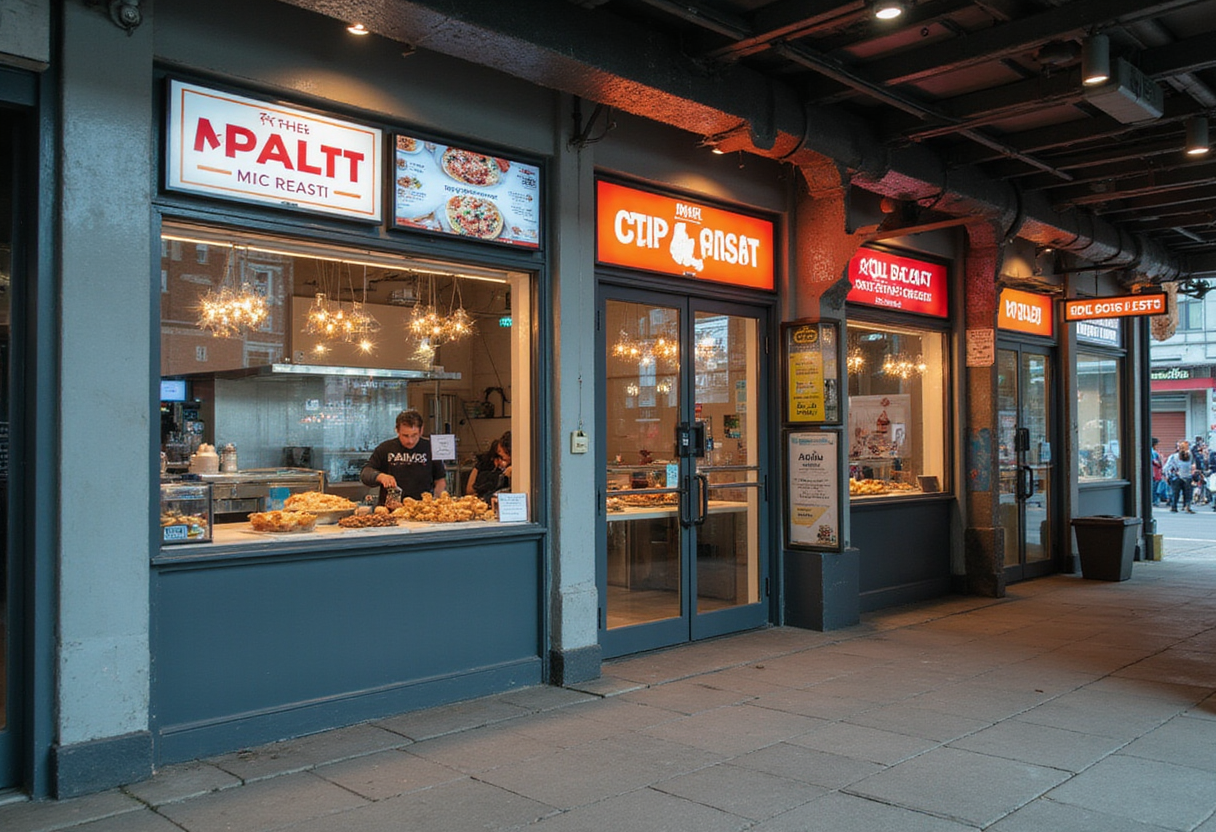
Visual Capitalist published a cross-border comparison ranking of where eating out costs the most and where it costs the least, sharpening attention on check-average spreads that increasingly shape chain expansion strategy.
The visual ranking revisits a comparison operators and travel analysts return to regularly: which global markets demand the steepest per-cover spend, and which deliver the cheapest meals. The data lands with operators during a period when several multi-unit groups are reassessing geographic footprints built up over the previous expansion cycle.
What does the ranking actually compare?
Cross-border dining cost comparisons typically rest on a narrow set of metrics — most often the cost of an inexpensive restaurant meal, a mid-range three-course dinner, or a blended composite of both. The methodology decisions that shape those figures carry as much operator consequence as the rankings themselves.
Whether the published number includes value-added tax, goods and services tax, mandatory service charges, or gratuity changes the comparison meaningfully. A menu price in a market with 20% VAT and a service-inclusive pricing convention reports a fundamentally different figure than a U.S. check that excludes tax and tip until the end of the meal.
For U.S.-based chains reviewing the data for international expansion, the methodology gap matters most when the ranking appears to favor or penalize markets where the company's existing footprint already operates under different pricing conventions.
How do labor and occupancy distort the raw numbers?
Check averages tell operators little about unit economics in isolation. Labor cost percentages, occupancy expense, and statutory benefit requirements in higher-cost jurisdictions can erode the margin advantage that elevated per-cover revenue appears to deliver.
In markets where paid leave, healthcare contributions, or union density push labor above 35% of sales, even a high check average can produce thinner operating margins than a mid-range market with disciplined labor scheduling. The published ranking captures the top line but says nothing about the cost stack beneath it.
Real estate stacks a second distortion on top. Prime locations in the ranking's most expensive cities typically carry rent multiples that would render the same concept uneconomic in cheaper markets. Operators expanding into marquee global addresses frequently find that revenue per cover does not convert proportionally into operating profit.
What does this mean for pricing architecture?
When check averages diverge sharply across markets, chains typically respond through menu engineering rather than uniform pricing. The tools — modifier attachment, beverage mix optimization, limited-time value tiers, and length-of-stay management — translate per-cover revenue into per-guest margin regardless of the headline price point.
For franchised concepts, the math stacks differently. Royalty, advertising fund contributions, and franchise fees apply on top of local unit economics. A franchisee in a high-check market faces a larger absolute contribution to the brand system than a peer in a lower-check market, which can either cushion or strain unit-level margins depending on labor and occupancy exposure.
What's the operator takeaway?
The ranking will draw close attention from development teams preparing upcoming unit pipelines, particularly those weighing whether the cost-of-dining premium in marquee global cities still justifies brand-equity exposure. Several operators that expanded aggressively into higher-cost European and Asian capitals during the past cycle have already begun pruning underperforming units while accelerating growth in markets where check averages are lower but contribution margins run stronger.
The forward question for 2025 development planning is not which market sits at the top of the ranking, but whether the operator's existing unit-economics model still produces an acceptable return on the underlying check average once labor, occupancy, and brand-system costs are layered in.
More from Rebecca Stone
Show full bio
Senior reporter covering media and advertising at The Pass Brief.
225 articles