USDA Updates Its Essentials on Food Prices and Spending
USDA's refreshed essentials chartbook tracks U.S. food prices and the split between grocery and restaurant spending — a free federal benchmark for operators.
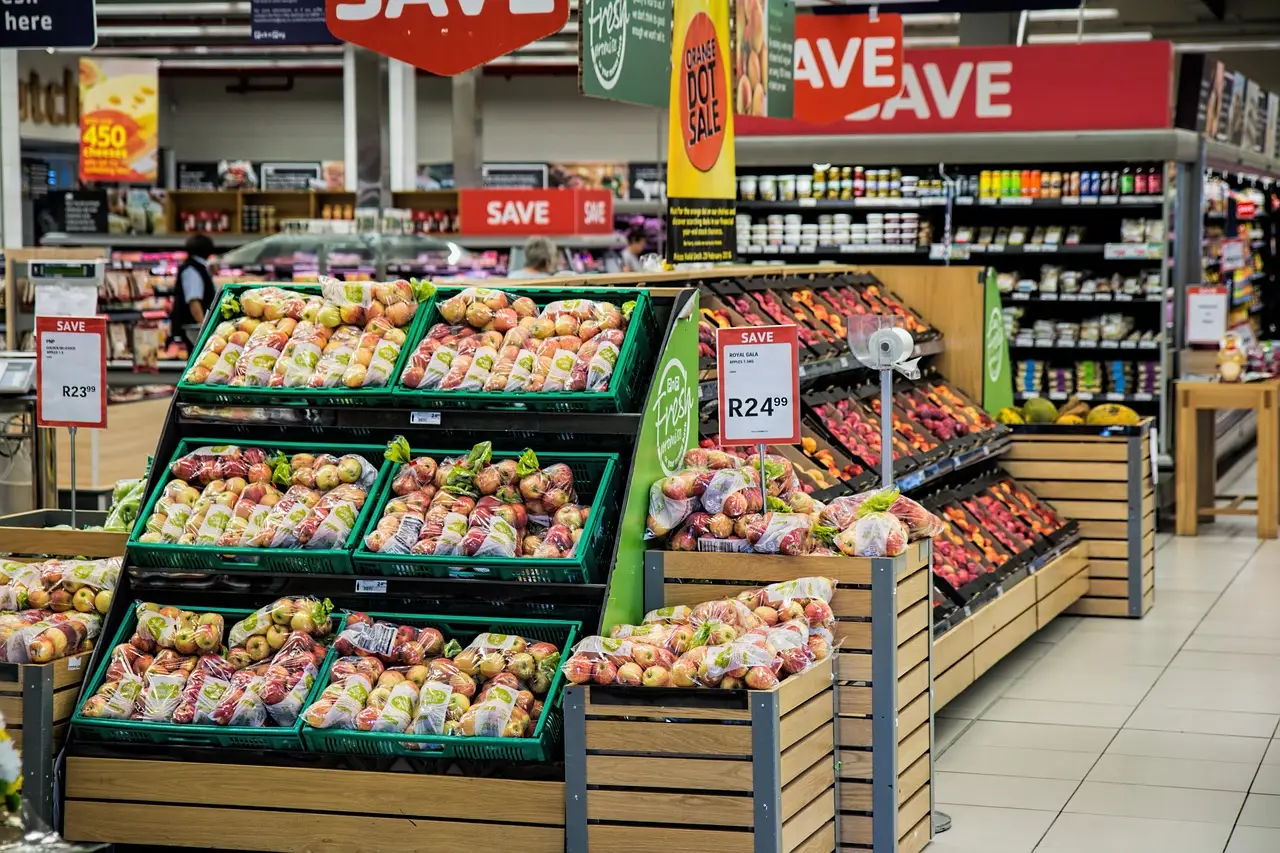
The USDA has refreshed "Ag and Food Statistics: Charting the Essentials," its running chartbook on food prices and household food spending. The agency publishes the series through its Economic Research Service (ERS), the USDA unit responsible for farm and food economics.
For operators, the document matters as a benchmark. It aggregates price and spending data across the food system, giving restaurant groups a federal baseline against which to read their own menu pricing and cost-of-goods trends.
What does the chartbook actually cover?
The essentials series condenses ERS statistics into visual form. Its food prices and spending section tracks:
- how much U.S. households spend on food,
- how retail food prices move over time,
- and how spending divides between food at home and food away from home (the grocery-versus-restaurant split).
That last distinction carries weight for the industry. Food-away-from-home spending is the slice that maps most directly onto restaurant revenue, and the USDA series is the standard federal reference for its trajectory.
Why should restaurant operators care?
Menu pricing does not happen in a vacuum. When the federal data shows grocery inflation accelerating or decelerating, operators face downstream pressure on guest perception of value and on their own commodity costs. The USDA charts give a neutral, government-published reference point — useful in board decks and investor narratives alike.
The series is also a sourcing signal. Aggregate price movement in the data reflects supply-chain conditions that eventually reach operator invoices, whether through proteins, produce, or packaged goods.
The chartbook is publicly available on the USDA's .gov domain, which makes it citable and free — a modest virtue in an era of paywalled market research.
The takeaway
The federal numbers will keep arriving on their own schedule. Operators who align pricing and menu-engineering decisions with the published trend lines, rather than anecdote, will have the cleaner story when costs move again.
More from Rebecca Stone
Show full bio
Senior reporter covering technology and product news in Restaurant and hotel operations at The Pass Brief.
477 articles